How to use the AGP

At first, the ambulatory glucose profile may look a bit confusing. Using a step-by-step approach will give you a good feel for what the AGP is telling you.
Low blood glucose (hypos)
This is a good place to start as it is difficult to achieve good blood glucose control if you are struggling with hypos. Is there any grey or blue in the hypoglycaemic zone below the target glucose range? If so, then there is a trend to low glucose at these times.
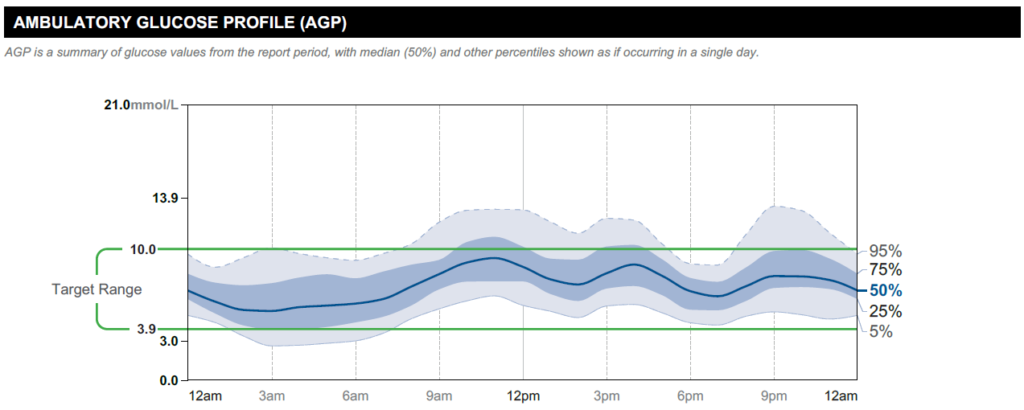
How predictable are these hypoglycaemic trends? A low median line with blue and grey bands extending below the low-glucose threshold indicates a consistent trend.
Some things to think about:

- When are hypos occurring? You can also look at the “Low Glucose Events” log and “Glucose Pattern Insights” on Libreview to give you a feel for when you go low or are most at risk of going low.

If so…
- Is your background insulin dose too much?
- Is there a link between dropping low overnight and exercise the day before or alcohol the evening before?

- How much carbohydrate are you having?
- If you are carbohydrate counting, are you counting carbohydrate correctly?

- How much insulin are you taking?
- If you are carbohydrate counting, is your insulin to carbohydrate ratio correct?
High blood glucose
Look for trends of high glucose above the upper limit of the target glucose range of 10 mmol/L, especially if they are persistent as indicated by a high median glucose line (black/blue solid line) bordered by a narrow blue band.
Is there any grey or blue above the upper limit of the target glucose range? If so, then there is a trend to high glucose at these times.
The following example shows a median line as well as blue and grey bands going above the goal. The visible white space below the line and bands (sometimes known as “air under the clouds”) means that there is room to improve blood glucose without the risk of hypoglycaemia.
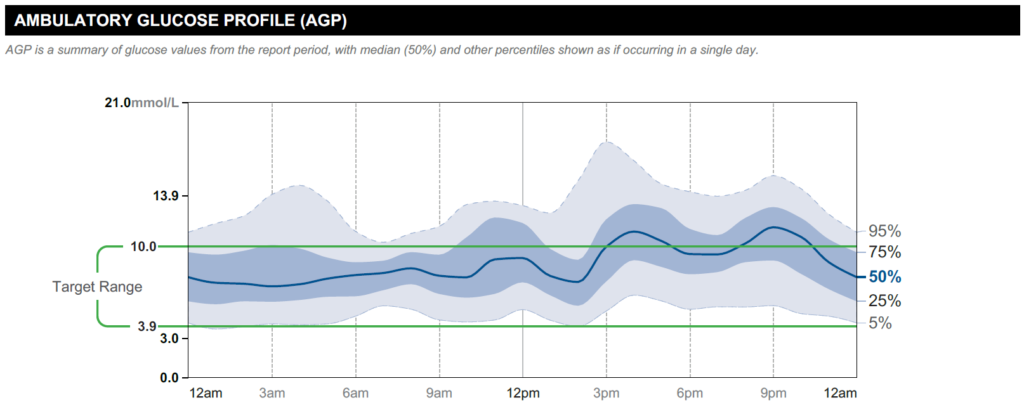
How predictable are these high glucose trends? A high median line (black/blue solid line) with blue and grey bands extending above the upper limit of the target glucose range indicates a consistent trend.
Some things to think about:

- Does it occur at certain times of the week? Can you identify what is different at those times that push the blood glucose up?
- Have you been unwell?
- Have you started any new medication?
- Have you missed doses of insulin?
- If you are carbohydrate counting, is your insulin to carbohydrate ratio correct?
- If you are carbohydrate counting, is your insulin correction dose correct?
- Is your basal insulin dose too low or too high?
- Timing
- Have you given your insulin after a meal?
- Do you need to give your insulin a bit earlier before you eat?
- Are you counting carbohydrates correctly?
- Are you over-treating a hypo?
Adjusting basal insulin
You may find the following videos from the Association of British Clinical Diabetologists (ABCD) useful in helping you use the data from your Freestyle Libre to adjust your basal insulin.

Leave a Reply
You must be logged in to post a comment.